Who contributes at each visit?
Subject by scheduled visit, including explicit missing rows. Start with aggregate completeness, then locate individual gaps in the observation matrix. Missing assessments are not automatically withdrawals.
Clinical Figure Library / By Jaime Yan
Five executed R/Python teaching cases connect distributions, missingness and uncertainty. All inputs are fictional. Choose a path below, then inspect results, assumptions and evidence together.
Subject by scheduled visit, including explicit missing rows. Start with aggregate completeness, then locate individual gaps in the observation matrix. Missing assessments are not automatically withdrawals.
Subject by baseline/follow-up outcome. Inspect the complete-pair change distribution. For multiple domains, compare descriptive profiles with within-arm changes and intervals.
Subject, treatment, baseline and follow-up per domain. Move from within-arm summaries to baseline-adjusted contrasts. Complete-case adjustment does not resolve missing-data bias.
Population switching uses separately computed results. Downloads follow the current language and population unless labeled otherwise. Each case links its own methods and QC; numerical agreement is not external clinical validation.
Actual executed previews, using Python and all fictional participants. Open a case to switch to R or a population stratum.
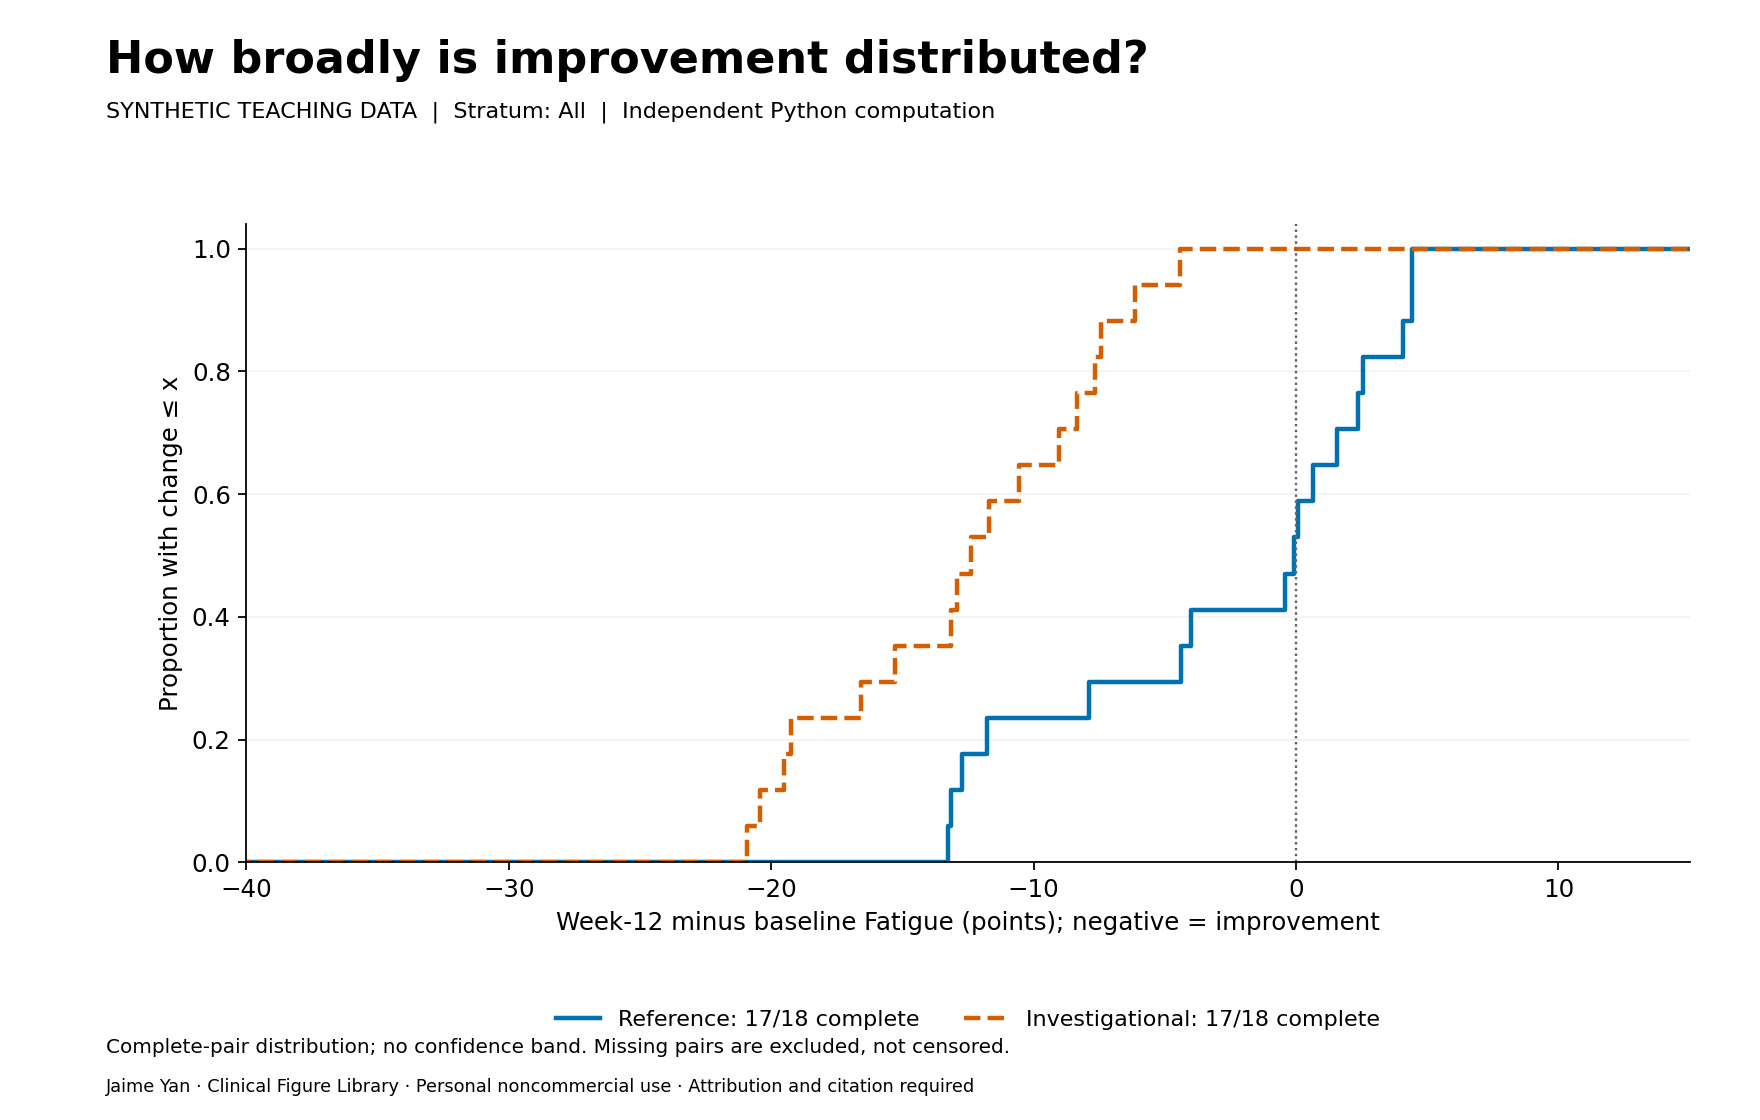
Is the observed improvement broadly distributed, or concentrated in a few participants?
Descriptive analysis · Independent R + Python · Synthetic data
Review results, methods & evidence →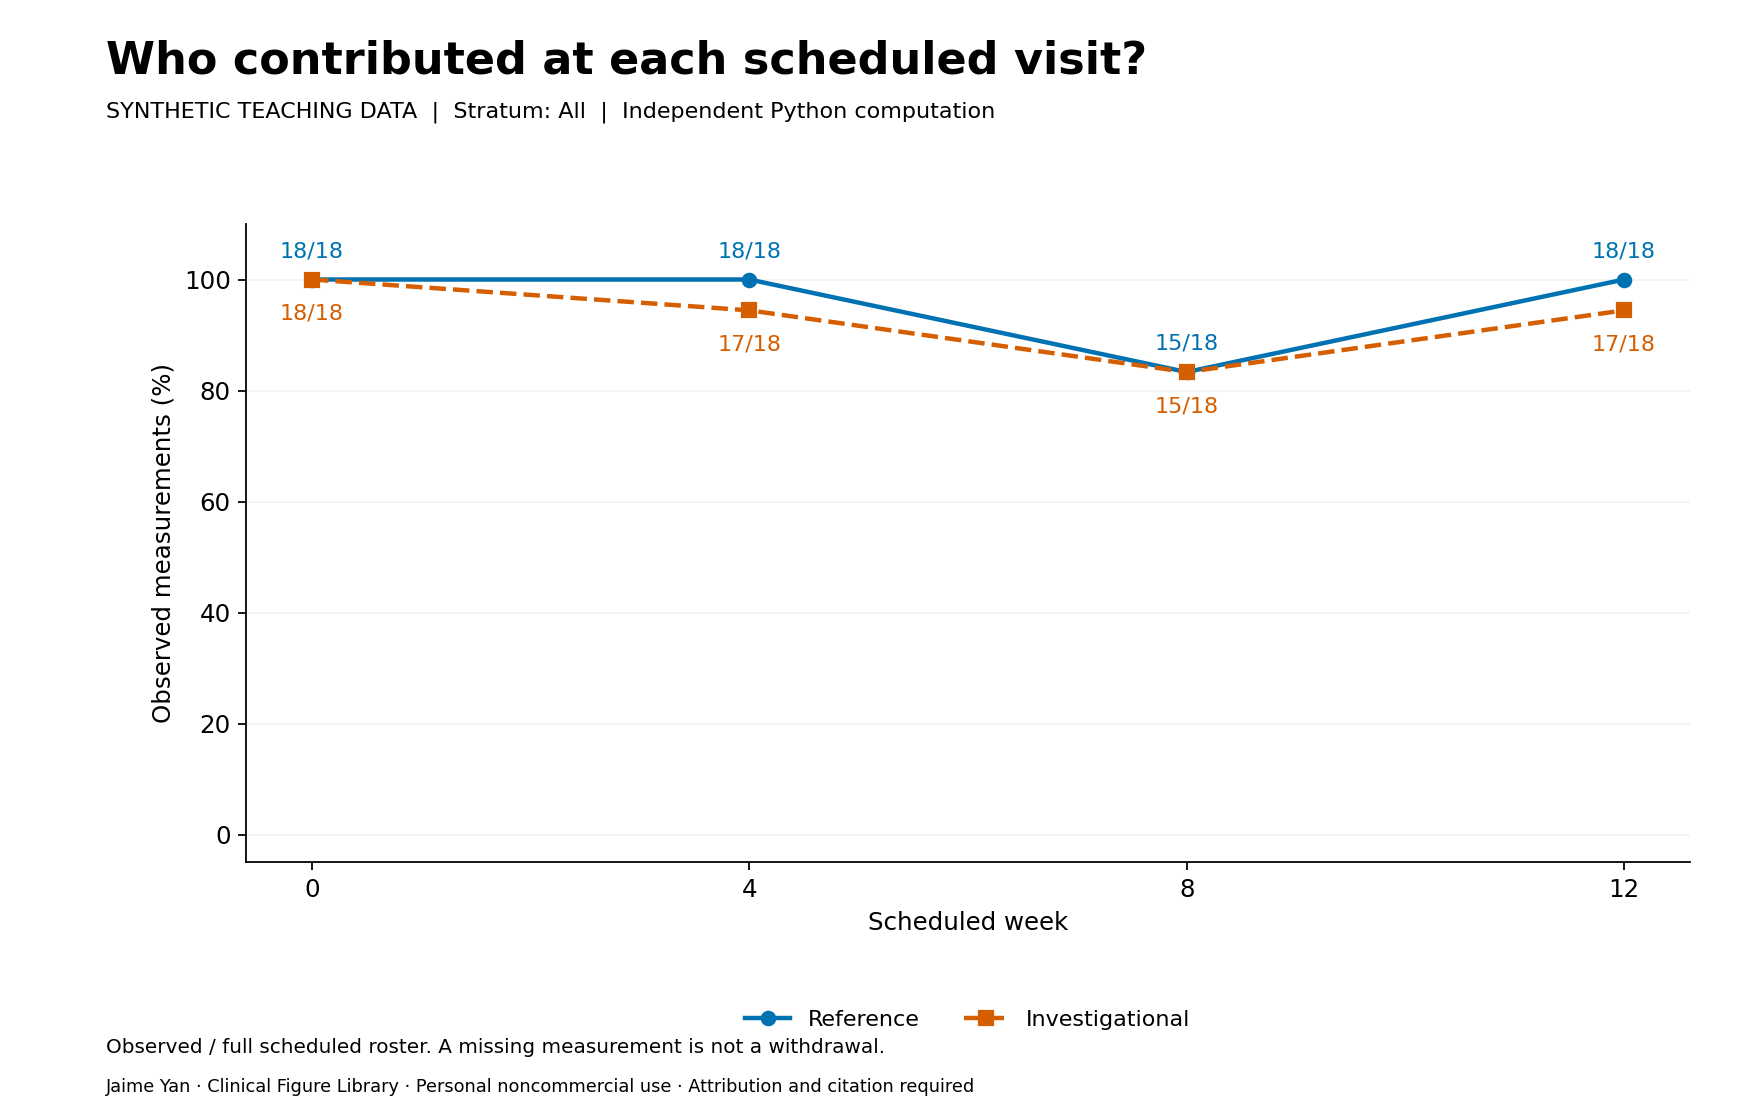
How much of the scheduled population contributes at each visit?
Descriptive analysis · Independent R + Python · Synthetic data
Review results, methods & evidence →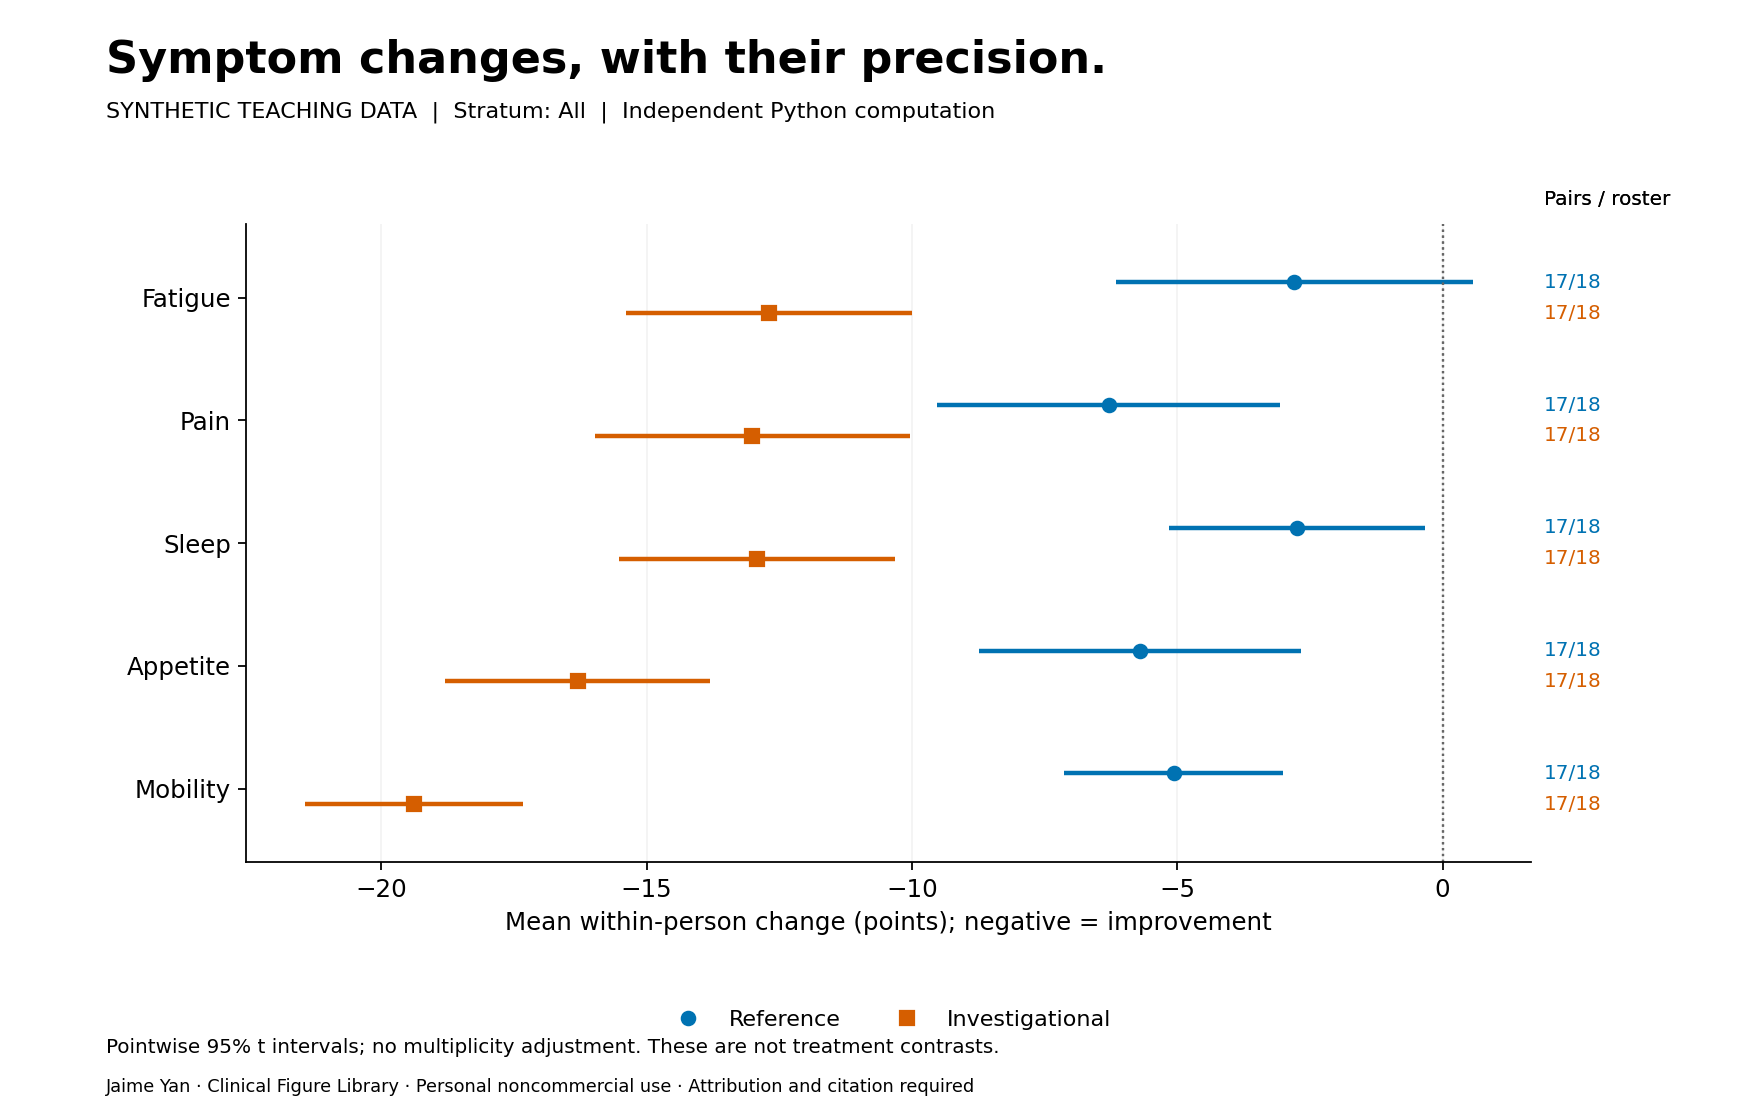
How large are the observed changes in each domain, and how precisely are their means estimated?
Descriptive analysis · Independent R + Python · Synthetic data
Review results, methods & evidence →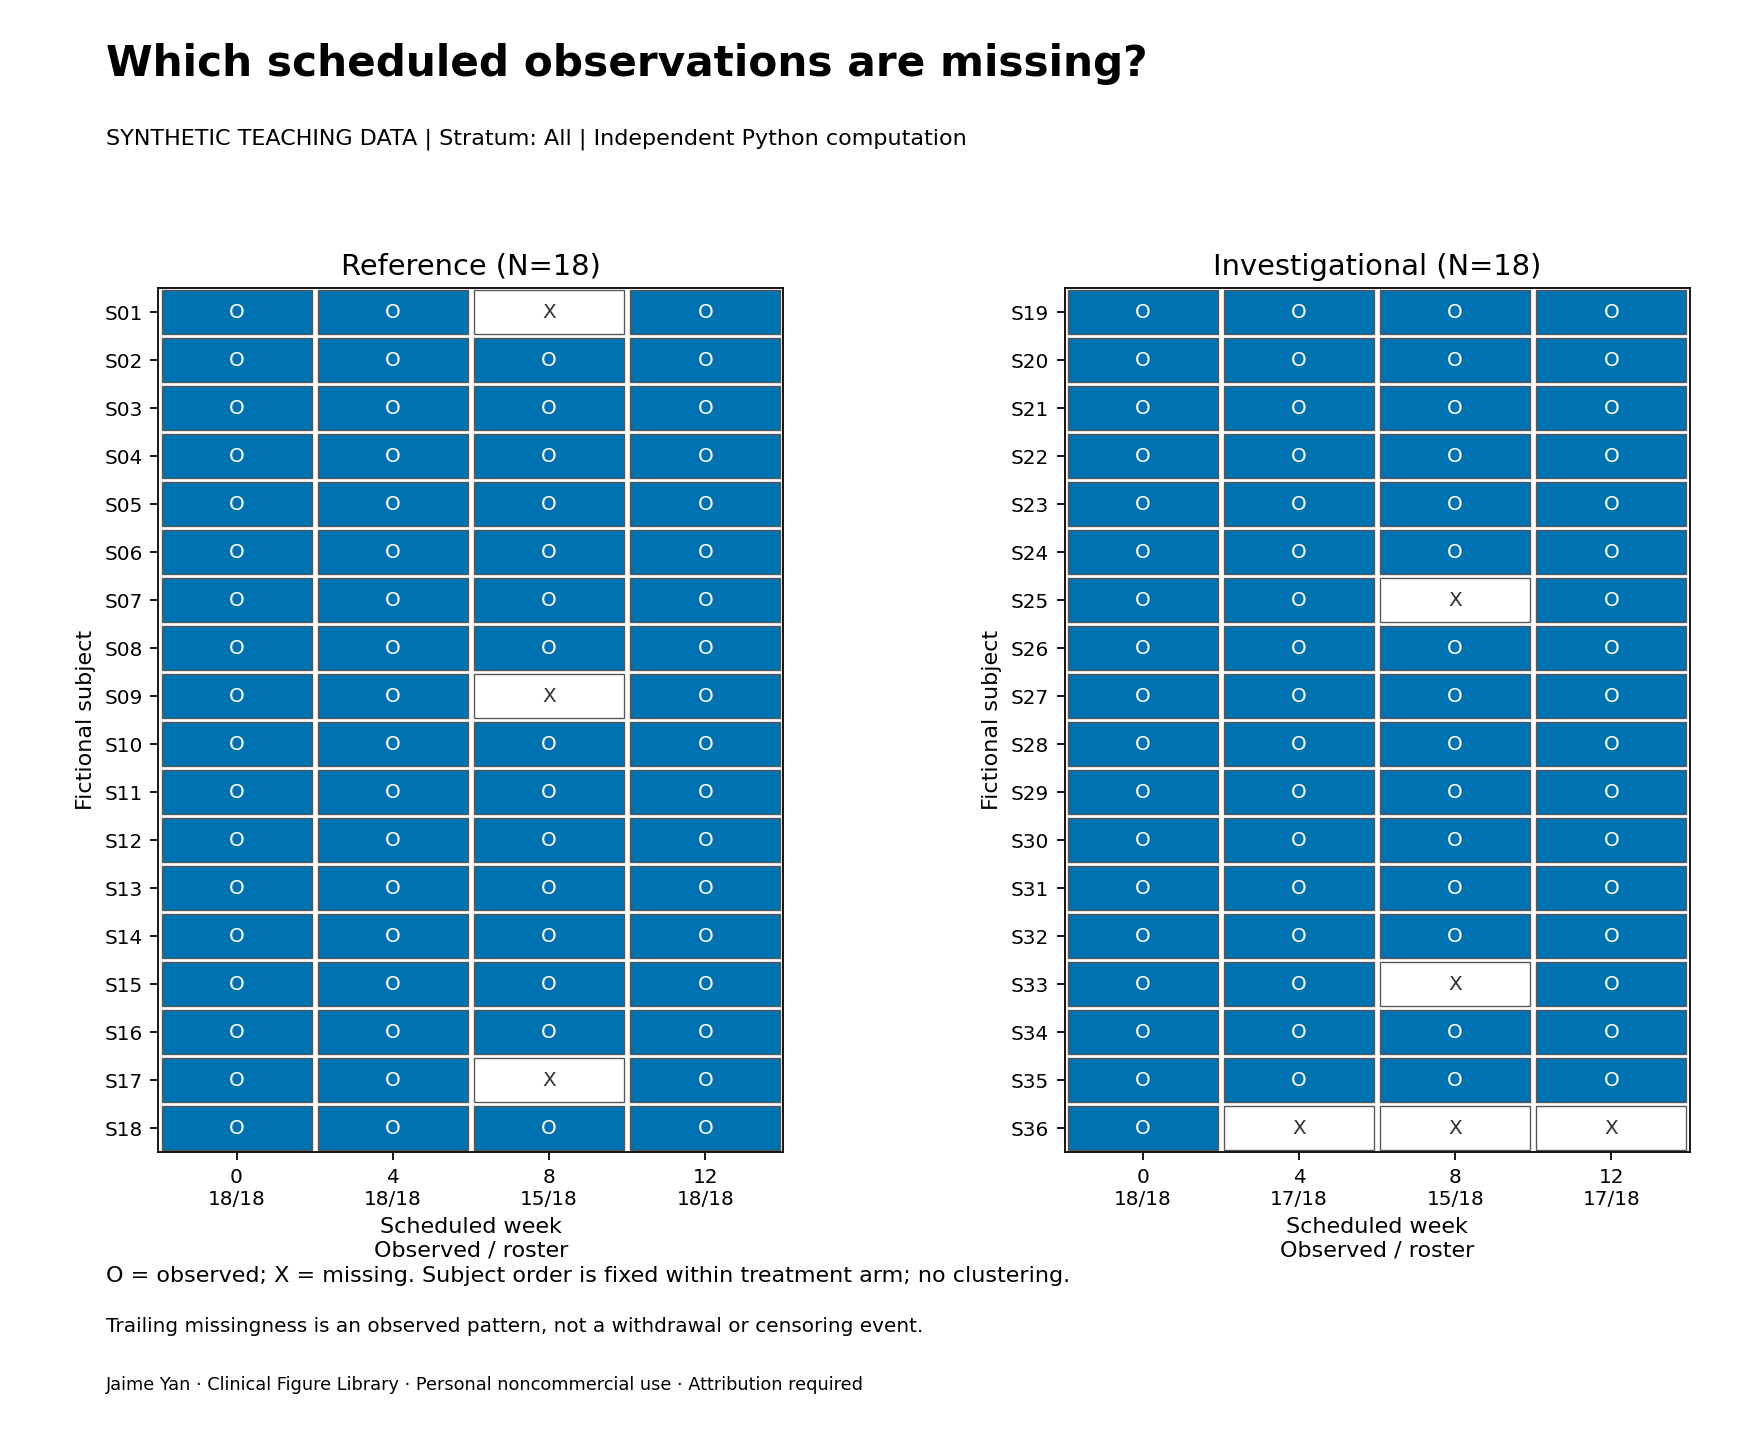
Are missing assessments isolated gaps or trailing runs within individual participants?
Descriptive analysis · Independent R + Python · Synthetic data
Review results, methods & evidence →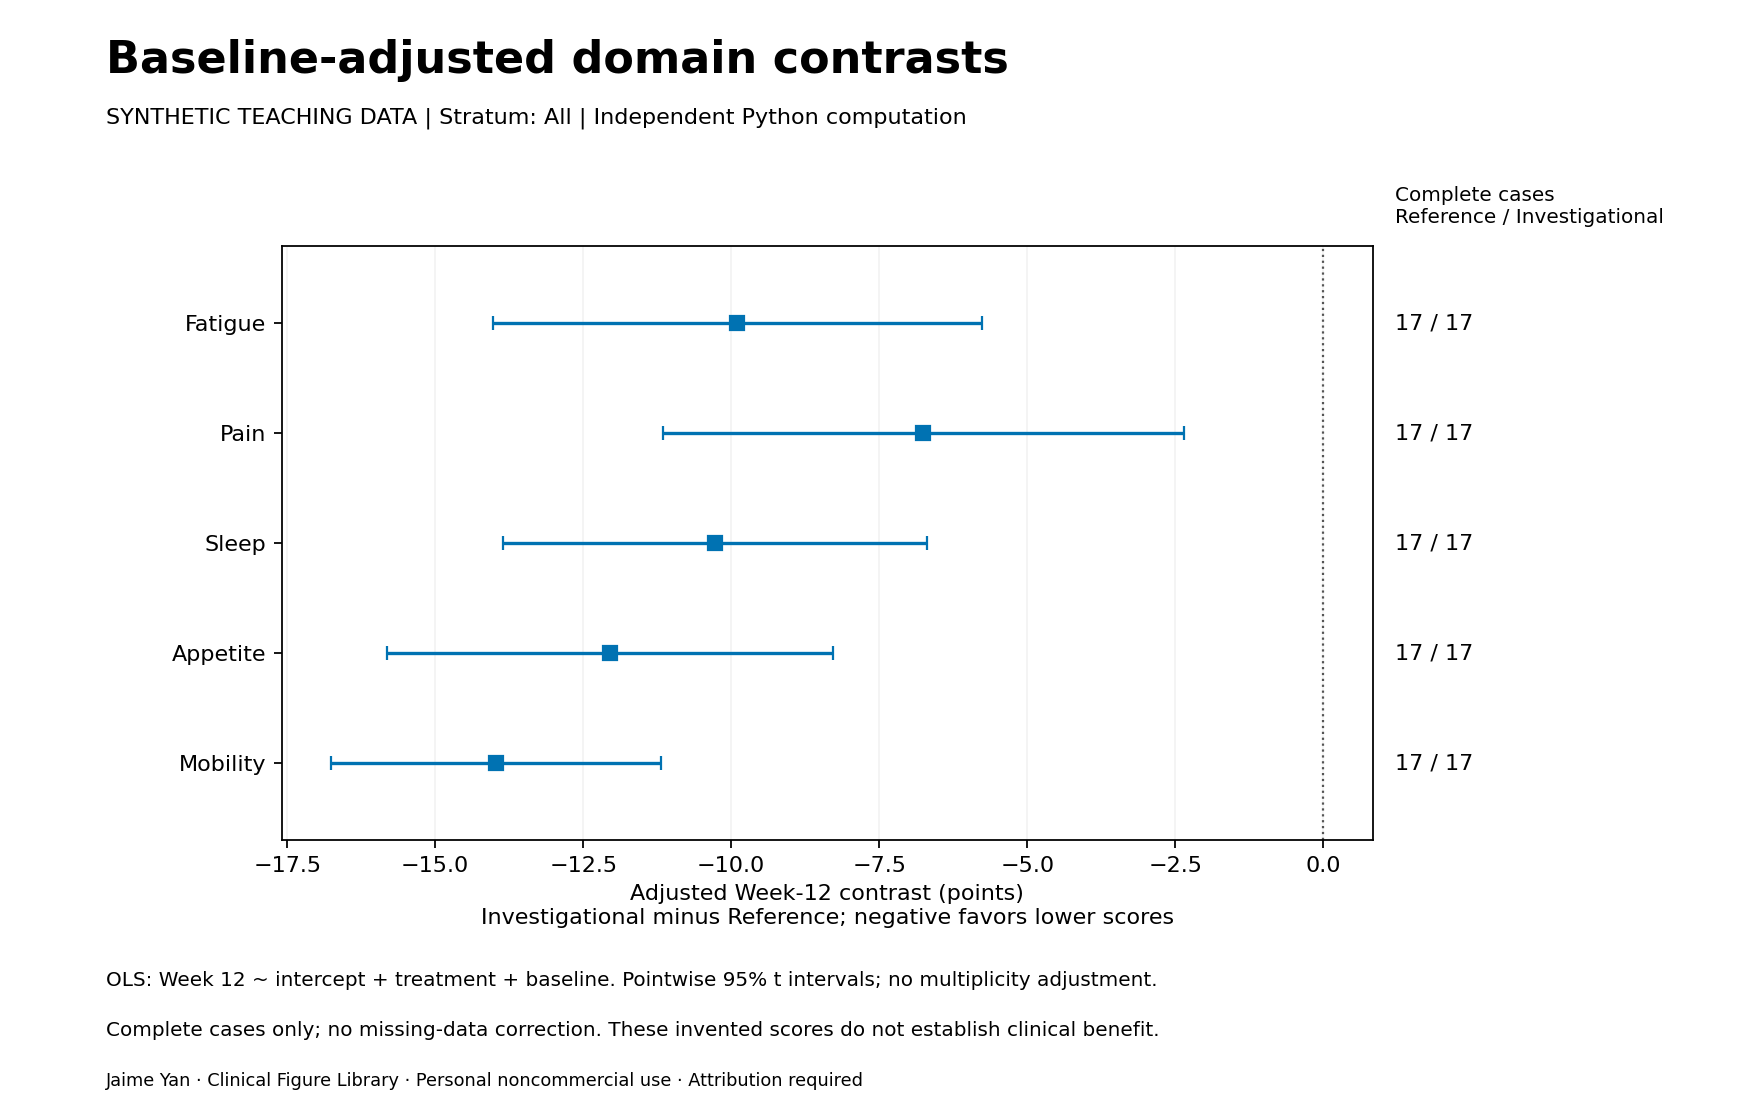
What is the fitted between-arm Week-12 difference after adjusting for baseline within complete cases?
Model-based complete-case contrast · Independent R + Python · Synthetic data
Review results, methods & evidence →Quality framework & clinical coverage · Research directory · Comparisons and known disadvantages
Upstream rights · Cite Jaime Yan and upstream work · License
Original work: personal noncommercial use with required attribution. Upstream software retains its own licenses. Formal screen-reader and different-engine evaluation remain incomplete. No regulatory-validation claim.