Estimation & units
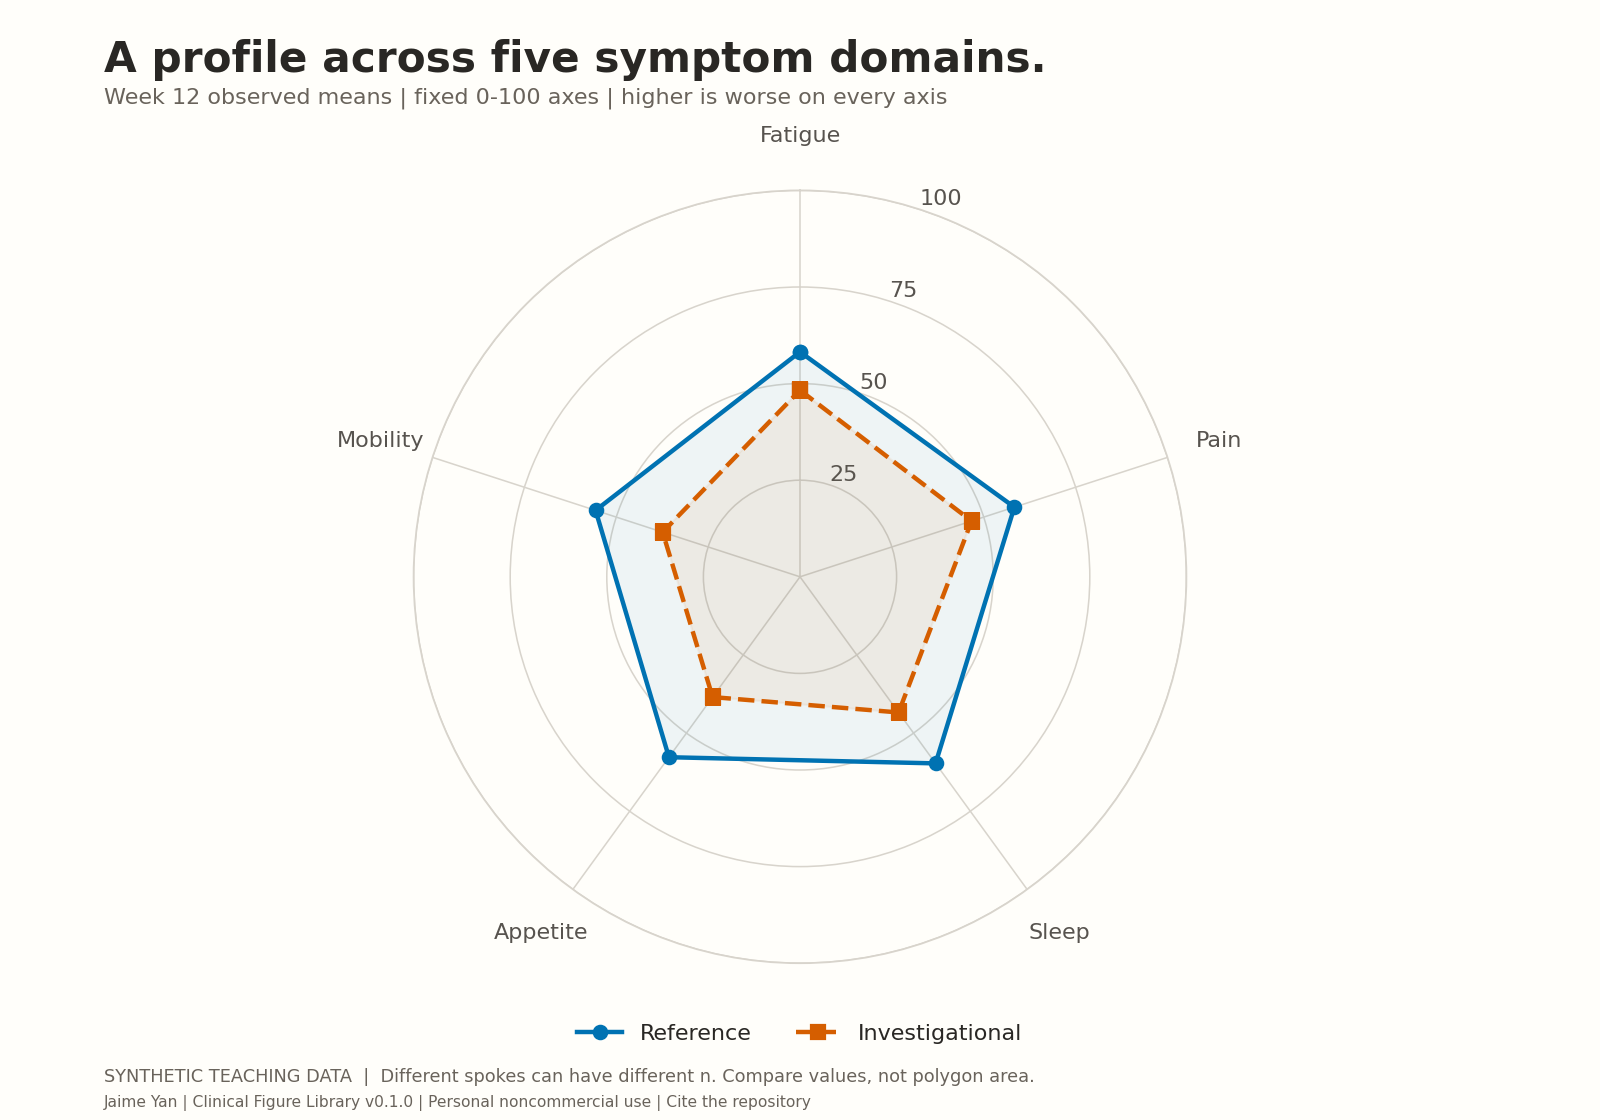
Calculate observed week-12 arithmetic means separately by arm and domain. Each spoke uses the same fixed 0–100 scale. Higher is worse on all five axes. No normalization to observed minima/maxima, axis reversal or clipping.
Clinical Data Lab / Figure Library / Radar
Multidomain profile · Synthetic teaching data
Where do the observed symptom profiles differ across domains?
This is the exact reusable source executed for all six templates. Download the bundle for its runner, inputs and environment.
# Copyright (c) 2026 Jaime Yan. Personal noncommercial use only.
# Attribution and citation required; see LICENSE and CITATION.cff.
"""Explicit clinical figure contracts, with editable Matplotlib return values."""
import math
import numpy as np
import pandas as pd
from scipy.stats import t
import matplotlib
matplotlib.use("Agg")
import matplotlib.pyplot as plt
from matplotlib.lines import Line2D

ARMS = ["Reference", "Investigational"]
COLORS = dict(zip(ARMS, ["#0072B2", "#D55E00"]))
DOMAINS = ["Fatigue", "Pain", "Sleep", "Appetite", "Mobility"]
KINDS = ["waterfall", "forest", "radar", "swimmer", "spider", "shift"]
TITLES = dict(zip(KINDS, ["Every participant. One best observed change.",
    "Effects in context, with uncertainty.", "A profile across five symptom domains.",
    "Follow-up, one participant at a time.", "The trajectory behind the best change.",
    "From baseline category to week 12."]))

def validate(frames):
    s, d, q = (frames[k] for k in ("subjects", "tumor", "domains"))
    for frame, key in [(s,["subject"]),(d,["subject","week"]),(q,["subject","domain","week"])]:
        if frame[key].isna().any().any() or frame.duplicated(key).any():
            raise ValueError(f"Missing or duplicate key: {key}")
    if set(s.arm) != set(ARMS) or not set(s.sex).issubset({"F", "M"}) or s.age.isna().any():
        raise ValueError("Invalid arm, sex or age")
    for frame in [d,q]:
        if not set(frame.subject).issubset(set(s.subject)):
            raise ValueError("Unknown subject")
    if not all(set(g.week) == {0,4,8,12} for _,g in d.groupby("subject")) or set(d.subject) != set(s.subject):
        raise ValueError("Tumor schedule must retain 0,4,8,12 including missing visits")
    if not all(set(g.week) == {0,12} for _,g in q.groupby(["subject","domain"])) or set(q.domain) != set(DOMAINS) or len(q) != len(s)*10:
        raise ValueError("Domain schedule must retain all baseline and week-12 rows")
    base = d.loc[d.week == 0, "diameter"]
    if base.isna().any() or (base <= 0).any() or (d.diameter.dropna() <= 0).any():
        raise ValueError("Observed diameter and every baseline must be positive")
    if not q.score.dropna().between(0,100).all():
        raise ValueError("Domain score outside fixed 0-100 scale")
    if s[["followup","milestone","ongoing"]].isna().any().any() or (s.followup < s.milestone).any() or (s.milestone < 0).any() or not s.ongoing.isin([0,1]).all():
        raise ValueError("Impossible follow-up dates or ongoing flag")

def welch(a, b):
    """Independent two-sample mean difference and Welch 95% interval."""
    a, b = np.asarray(a, float), np.asarray(b, float)
    if min(len(a), len(b)) < 2:
        raise ValueError("Welch interval needs at least two complete pairs per arm")
    va, vb = a.var(ddof=1)/len(a), b.var(ddof=1)/len(b)
    se = math.sqrt(va+vb)
    if se == 0:
        raise ValueError("Undefined Welch degrees of freedom: zero variance")
    df = (va+vb)**2/(va**2/(len(a)-1)+vb**2/(len(b)-1))
    estimate = a.mean()-b.mean()
    width = t.ppf(.975,df)*se
    return estimate, estimate-width, estimate+width, df

def prepare(kind, frames):
    validate(frames)
    if kind not in KINDS: raise ValueError("Unknown figure kind")
    s, d, q = (frames[k].copy() for k in ("subjects", "tumor", "domains"))
    d = d.merge(s[["subject","arm"]], on="subject", validate="many_to_one")
    base = d.loc[d.week==0].set_index("subject").diameter
    d["change"] = 100*(d.diameter / d.subject.map(base) - 1)
    if kind == "waterfall":
        rows = d.loc[d.week>0].groupby(["subject","arm"], sort=True).agg(estimate=("change","min"),n=("change","count")).reset_index()
        rows = rows.loc[rows.n>0].sort_values(["estimate","subject"]).reset_index(drop=True)
        rows["rank"] = np.arange(1,len(rows)+1)
        return rows[["subject","arm","estimate","n","rank"]]
    if kind == "spider":
        d["visit_n"] = d.groupby(["arm","week"]).change.transform("count")
        return d[["subject","arm","week","diameter","change","visit_n"]].sort_values(["subject","week"]).reset_index(drop=True)
    if kind == "swimmer":
        out = s[["subject","arm","followup","milestone","ongoing"]].sort_values(["arm","followup","subject"], ascending=[True,False,True]).reset_index(drop=True)
        out["rank"] = np.arange(1,len(out)+1)
        return out
    if kind == "radar":
        q = q.loc[q.week==12].merge(s[["subject","arm"]], on="subject")
        out = q.groupby(["arm","domain"]).score.agg(estimate="mean",n="count").reset_index()
        out["missing"] = out.arm.map(s.arm.value_counts()) - out.n
        out["axis_order"] = out.domain.map({v:i+1 for i,v in enumerate(DOMAINS)})
        return out.sort_values(["arm","axis_order"]).reset_index(drop=True)
    if kind == "forest":
        f = q.loc[q.domain=="Fatigue"].pivot(index="subject", columns="week", values="score")
        f["change"] = f[12]-f[0]
        f = s.merge(f[["change"]],on="subject").dropna(subset=["change"])
        groups = [("Overall",f),("Female",f.loc[f.sex=="F"]),("Male",f.loc[f.sex=="M"]),
                  ("Age <65",f.loc[f.age<65]),("Age >=65",f.loc[f.age>=65])]
        out = []
        for i,(label,g) in enumerate(groups):
            a,b = [g.loc[g.arm==arm,"change"].to_numpy() for arm in ARMS[::-1]]
            est,lo,hi,df = welch(a,b)
            out.append(dict(subgroup=label,rank=i+1,n_reference=len(b),n_investigational=len(a),estimate=est,lower=lo,upper=hi,df=df))
        return pd.DataFrame(out)
    if kind == "shift":
        def category(v): return "L" if v<.5 else "N" if v<=1 else "H"
        out=[]
        for arm in ARMS:
            g=s.loc[s.arm==arm].dropna(subset=["alt_baseline","alt_week12"])
            for i,b in enumerate(["L","N","H"]):
                for j,p in enumerate(["L","N","H"]):
                    n=sum((g.alt_baseline.map(category)==b)&(g.alt_week12.map(category)==p))
                    out.append(dict(arm=arm,baseline=b,week12=p,n=int(n),denominator=len(g),percent=100*n/len(g) if len(g) else np.nan,row=i+1,column=j+1))
        return pd.DataFrame(out)

def theme():
    plt.rcParams.update({"font.family":"DejaVu Sans","font.size":10,"axes.spines.top":False,
        "axes.spines.right":False,"axes.edgecolor":"#C9C4BB","axes.labelcolor":"#423F3B",
        "text.color":"#292724","xtick.color":"#57534E","ytick.color":"#57534E",
        "figure.facecolor":"#FFFEFA","axes.facecolor":"#FFFEFA","savefig.facecolor":"#FFFEFA",
        "svg.fonttype":"path","svg.hashsalt":"clinical-figure-library-v1","axes.axisbelow":True})

def decorate(fig, kind, subtitle, note):
    fig.suptitle(TITLES[kind], x=.065, y=.965, ha="left", fontsize=19, weight="bold")
    fig.text(.065,.908,subtitle,fontsize=10,color="#69635B")
    fig.text(.065,.034,"SYNTHETIC TEACHING DATA  |  "+note,fontsize=8,color="#69635B")
    fig.text(.065,.012,"Jaime Yan | Clinical Figure Library v0.1.0 | Personal noncommercial use | Cite the repository",fontsize=7,color="#69635B")

def draw(kind, data):
    """Return an editable Figure. All calculations happen in prepare(), not here."""
    theme()
    if kind == "radar":
        fig=plt.figure(figsize=(10,7)); ax=fig.add_axes([.15,.14,.70,.69],projection="polar")
        angles=np.linspace(0,2*np.pi,len(DOMAINS),endpoint=False)
        ax.set_theta_offset(np.pi/2);ax.set_theta_direction(-1)
        for i,arm in enumerate(ARMS):
            g=data.loc[data.arm==arm].sort_values("axis_order")
            vals=g.estimate.to_numpy(); a=np.r_[angles,angles[0]];v=np.r_[vals,vals[0]]
            ax.plot(a,v,color=COLORS[arm],ls=["-","--"][i],marker=["o","s"][i],lw=2,label=arm)
            ax.fill(a,v,color=COLORS[arm],alpha=.065)
        ax.set_xticks(angles,DOMAINS);ax.tick_params(axis="x",pad=14)
        ax.set_ylim(0,100);ax.set_yticks([25,50,75,100]);ax.set_rlabel_position(18)
        ax.grid(color="#D8D4CC",lw=.7);ax.spines["polar"].set_color("#D8D4CC")
        ax.legend(loc="lower center",bbox_to_anchor=(.5,-.13),ncol=2,frameon=False)
        decorate(fig,kind,"Week 12 observed means | fixed 0-100 axes | higher is worse on every axis",
                 "Different spokes can have different n. Compare values, not polygon area.")
        return fig
    fig, ax=plt.subplots(figsize=(11,7))
    fig.subplots_adjust(left=.10,right=.95,bottom=.17,top=.80)
    if kind == "waterfall":
        for arm in ARMS:
            g=data.loc[data.arm==arm]
            ax.bar(g["rank"],g.estimate,color=COLORS[arm],width=.82,label=arm,
                   hatch="" if arm==ARMS[0] else "//",linewidth=.2,edgecolor="white")
        for y in [-30,20]:ax.axhline(y,color="#827C73",ls="--",lw=.9)
        ax.axhline(0,color="#827C73",lw=.8)
        ax.set_xticks(data["rank"],data.subject,rotation=90,fontsize=7)
        ax.set_ylabel("Best observed diameter change (%)");ax.set_xlabel("Participants ranked by best observed change")
        ax.grid(axis="y",alpha=.2);ax.legend(frameon=False,ncol=2,loc="lower left",bbox_to_anchor=(0,1.025))
        decorate(fig,kind,f"{len(data)} evaluable participants | ordered individual changes | lower is favorable",
                 "Dashed -30% / +20% guides are not confirmed RECIST response categories.")
    elif kind == "forest":
        fig.subplots_adjust(left=.30,right=.75)
        ax.axvline(0,color="#827C73",ls="--",lw=1)
        for i,r in data.iterrows():
            if i%2==0:ax.axhspan(i-.45,i+.45,color="#F2EFE9",zorder=0)
            ax.errorbar(r.estimate,i,xerr=[[r.estimate-r.lower],[r.upper-r.estimate]],fmt="D" if i==0 else "s",color=COLORS["Investigational"],capsize=4,ms=7)
            ax.text(1.025,i,f"{r.estimate:.2f} [{r.lower:.2f}, {r.upper:.2f}]",transform=ax.get_yaxis_transform(),va="center",fontsize=9)
        ax.set_yticks(range(len(data)),[f"{r.subgroup}   {r.n_reference}/{r.n_investigational}" for _,r in data.iterrows()])
        ax.invert_yaxis();ax.set_ylim(len(data)-.45,-.8)
        ax.set_xlabel("Mean difference (points)\nInvestigational minus Reference")
        ax.text(0,1.05,"Subgroup  |  n Ref/Inv",transform=ax.transAxes,ha="right",fontsize=9,weight="bold")
        ax.text(1.025,1.05,"Difference [95% CI]",transform=ax.transAxes,fontsize=9,weight="bold")
        ax.grid(axis="x",alpha=.18)
        decorate(fig,kind,"Week-12 Fatigue change | complete pairs | Welch t intervals | lower favors Investigational",
                 "Exploratory, overlapping subgroups. No interaction test or multiplicity adjustment.")
    elif kind == "swimmer":
        for i,arm in enumerate(ARMS):
            g=data.loc[data.arm==arm]
            ax.barh(g["rank"],g.followup,height=.64,color=COLORS[arm],alpha=.8,label=arm)
            ax.scatter(g.milestone,g["rank"],marker="D",s=16,facecolor="#FFFEFA",edgecolor="#292724",zorder=3)
            a=g.loc[g.ongoing==1];ax.scatter(a.followup,a["rank"],marker=">",s=40,color=COLORS[arm],zorder=4)
        ax.set_yticks(data["rank"],data.subject,fontsize=7);ax.invert_yaxis()
        ax.set_xlabel("Observed follow-up (weeks)");ax.set_xlim(0,data.followup.max()+2)
        ax.grid(axis="x",alpha=.2)
        ax.legend(handles=[Line2D([0],[0],lw=6,color=COLORS[a],label=a) for a in ARMS]+
                  [Line2D([0],[0],marker="D",color="#292724",ls="",markerfacecolor="white",label="Assessment"),
                   Line2D([0],[0],marker=">",color="#292724",ls="",label="Ongoing at cutoff")],
                  ncol=4,loc="lower left",bbox_to_anchor=(0,1.025),frameon=False,fontsize=8)
        decorate(fig,kind,f"{len(data)} participants | sorted within arm by duration | explicit event key",
                 "The assessment marker does not indicate response. Ongoing arrows do not extrapolate.")
    elif kind == "spider":
        for (_,arm),g in data.groupby(["subject","arm"]):
            ax.plot(g.week,g.change,color=COLORS[arm],ls="-" if arm==ARMS[0] else "--",lw=1,alpha=.58,marker="o",ms=2)
        ax.axhline(0,color="#827C73",lw=.8);ax.set_xticks([0,4,8,12])
        ax.set_xlabel("Scheduled visit (weeks)");ax.set_ylabel("Diameter change from baseline (%)")
        ax.grid(axis="y",alpha=.2)
        ax.legend(handles=[Line2D([0],[0],color=COLORS[a],ls="-" if i==0 else "--",label=a) for i,a in enumerate(ARMS)],frameon=False,ncol=2,loc="lower left",bbox_to_anchor=(0,1.025))
        decorate(fig,kind,"Individual observed trajectories | one line per participant | no fitted population trend",
                 "Missing visits break lines. Visit-specific observed n are available in the table.")
    elif kind == "shift":
        fig.delaxes(ax)
        for i,arm in enumerate(ARMS):
            ax=fig.add_axes([.12+i*.44,.22,.32,.52]);g=data.loc[data.arm==arm]
            matrix=g.pivot(index="row",columns="column",values="percent").to_numpy()
            ax.imshow(matrix,cmap="Blues",vmin=0,vmax=100)
            for _,r in g.iterrows():ax.text(r.column-1,r.row-1,f"{r.n}\n{r.percent:.1f}%",ha="center",va="center",color="#212121",fontsize=12)
            ax.set_xticks([0,1,2],["Low","Normal","High"]);ax.set_yticks([0,1,2],["Low","Normal","High"])
            ax.set_xlabel("Week-12 category");ax.set_ylabel("Baseline category")
            ax.set_title(f"{arm} | paired n={int(g.denominator.iloc[0])}",fontsize=11,pad=15)
        decorate(fig,kind,"ALT / ULN | Low <0.5; Normal 0.5-1; High >1 | count and % of paired arm n",
                 "Missing pairs excluded. Color scale fixed at 0-100%. Thresholds are illustrative.")
    else:raise ValueError("Unknown figure kind")
    return fig
Executed Python render · full example population
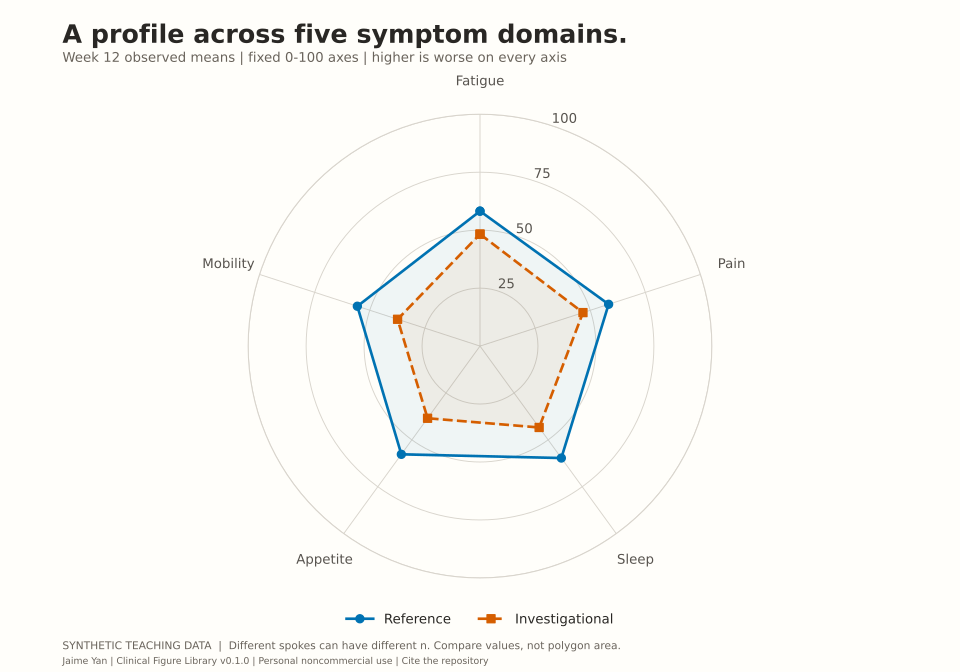
Figure could not be loaded. The computed data table remains available below.
Downloads contain the full computed figure or table for the selected language. Precomputed display; no code runs in your browser. Original author: Jaime Yan. Personal noncommercial use only; license terms and attribution and citation requirements apply.
Full-precision downloadable CSV; display rounded to three decimals. Search affects this table only, not the figure or downloads.
| Investigational | Fatigue | 48.283 | 17 | 1 | 1 |
| Investigational | Pain | 46.700 | 17 | 1 | 2 |
| Investigational | Sleep | 43.397 | 17 | 1 | 3 |
| Investigational | Appetite | 38.479 | 17 | 1 | 4 |
| Investigational | Mobility | 37.382 | 17 | 1 | 5 |
| Reference | Fatigue | 58.210 | 17 | 1 | 1 |
| Reference | Pain | 58.333 | 17 | 1 | 2 |
| Reference | Sleep | 59.689 | 17 | 1 | 3 |
| Reference | Appetite | 57.713 | 17 | 1 | 4 |
| Reference | Mobility | 55.629 | 17 | 1 | 5 |
Analysis contract
Calculate observed week-12 arithmetic means separately by arm and domain. Each spoke uses the same fixed 0–100 scale. Higher is worse on all five axes. No normalization to observed minima/maxima, axis reversal or clipping.
36 fictional participants; 18 per arm before domain-specific missingness. Each spoke has its own observed n and missing count. All five scales are invented, not validated instruments.
Polygon area is not an effect size. Axis ordering and connections affect perceived shape. Use the numerical table for comparisons; this profile is descriptive and has no confidence intervals.
36 fictional participants generated by repository code with seed 20260921. These data are separate from CDISC Pilot and contain no employer or patient records.
Subjects CSV · Tumor CSV · Domains CSVDownload and extract the source bundle. Run from its root using the existing versions in environment.json. No installation command is run by this website.
python scripts/generate_data.py
python scripts/render.py
Rscript --vanilla scripts/render.R
Rscript --vanilla scripts/verify.R
python scripts/verify.pyInspectable evidence
Independent R and Python calculations agree across 974 numeric values in six templates. Maximum absolute difference: 4.974e-14. Absolute and relative tolerance: 1e−9; counts match exactly.
These statuses describe the checks actually run, not regulatory approval. Browser acceptance is documented in the local delivery report.
Machine-readable QC · Source & input hashes · Design references & licenses
Source digest: e0c3785f95a6cb42d6288b05ce6acc86f2acd116dbfd98eab7993ffac10cdf49