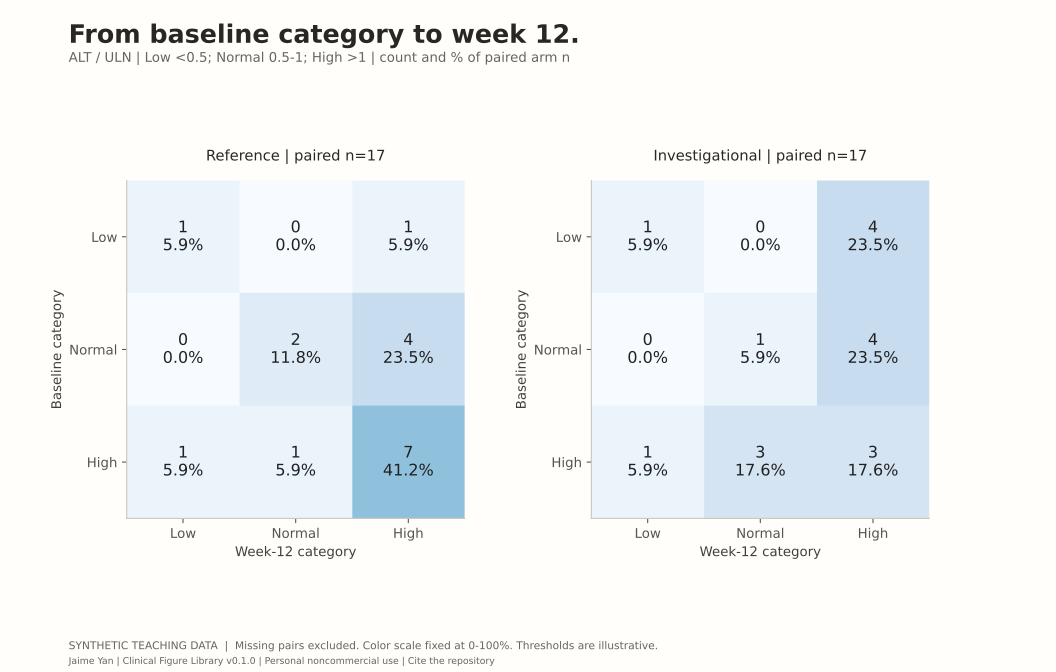
This is the exact reusable source executed for all six templates. Download the bundle for its runner, inputs and environment.
# Copyright (c) 2026 Jaime Yan. Personal noncommercial use only.
# Attribution and citation required; see LICENSE and CITATION.cff.
"""Explicit clinical figure contracts, with editable Matplotlib return values."""
import math
import numpy as np
import pandas as pd
from scipy.stats import t
import matplotlib
matplotlib.use("Agg")
import matplotlib.pyplot as plt
from matplotlib.lines import Line2D

ARMS = ["Reference", "Investigational"]
COLORS = dict(zip(ARMS, ["#0072B2", "#D55E00"]))
DOMAINS = ["Fatigue", "Pain", "Sleep", "Appetite", "Mobility"]
KINDS = ["waterfall", "forest", "radar", "swimmer", "spider", "shift"]
TITLES = dict(zip(KINDS, ["Every participant. One best observed change.",
    "Effects in context, with uncertainty.", "A profile across five symptom domains.",
    "Follow-up, one participant at a time.", "The trajectory behind the best change.",
    "From baseline category to week 12."]))

def validate(frames):
    s, d, q = (frames[k] for k in ("subjects", "tumor", "domains"))
    for frame, key in [(s,["subject"]),(d,["subject","week"]),(q,["subject","domain","week"])]:
        if frame[key].isna().any().any() or frame.duplicated(key).any():
            raise ValueError(f"Missing or duplicate key: {key}")
    if set(s.arm) != set(ARMS) or not set(s.sex).issubset({"F", "M"}) or s.age.isna().any():
        raise ValueError("Invalid arm, sex or age")
    for frame in [d,q]:
        if not set(frame.subject).issubset(set(s.subject)):
            raise ValueError("Unknown subject")
    if not all(set(g.week) == {0,4,8,12} for _,g in d.groupby("subject")) or set(d.subject) != set(s.subject):
        raise ValueError("Tumor schedule must retain 0,4,8,12 including missing visits")
    if not all(set(g.week) == {0,12} for _,g in q.groupby(["subject","domain"])) or set(q.domain) != set(DOMAINS) or len(q) != len(s)*10:
        raise ValueError("Domain schedule must retain all baseline and week-12 rows")
    base = d.loc[d.week == 0, "diameter"]
    if base.isna().any() or (base <= 0).any() or (d.diameter.dropna() <= 0).any():
        raise ValueError("Observed diameter and every baseline must be positive")
    if not q.score.dropna().between(0,100).all():
        raise ValueError("Domain score outside fixed 0-100 scale")
    if s[["followup","milestone","ongoing"]].isna().any().any() or (s.followup < s.milestone).any() or (s.milestone < 0).any() or not s.ongoing.isin([0,1]).all():
        raise ValueError("Impossible follow-up dates or ongoing flag")

def welch(a, b):
    """Independent two-sample mean difference and Welch 95% interval."""
    a, b = np.asarray(a, float), np.asarray(b, float)
    if min(len(a), len(b)) < 2:
        raise ValueError("Welch interval needs at least two complete pairs per arm")
    va, vb = a.var(ddof=1)/len(a), b.var(ddof=1)/len(b)
    se = math.sqrt(va+vb)
    if se == 0:
        raise ValueError("Undefined Welch degrees of freedom: zero variance")
    df = (va+vb)**2/(va**2/(len(a)-1)+vb**2/(len(b)-1))
    estimate = a.mean()-b.mean()
    width = t.ppf(.975,df)*se
    return estimate, estimate-width, estimate+width, df

def prepare(kind, frames):
    validate(frames)
    if kind not in KINDS: raise ValueError("Unknown figure kind")
    s, d, q = (frames[k].copy() for k in ("subjects", "tumor", "domains"))
    d = d.merge(s[["subject","arm"]], on="subject", validate="many_to_one")
    base = d.loc[d.week==0].set_index("subject").diameter
    d["change"] = 100*(d.diameter / d.subject.map(base) - 1)
    if kind == "waterfall":
        rows = d.loc[d.week>0].groupby(["subject","arm"], sort=True).agg(estimate=("change","min"),n=("change","count")).reset_index()
        rows = rows.loc[rows.n>0].sort_values(["estimate","subject"]).reset_index(drop=True)
        rows["rank"] = np.arange(1,len(rows)+1)
        return rows[["subject","arm","estimate","n","rank"]]
    if kind == "spider":
        d["visit_n"] = d.groupby(["arm","week"]).change.transform("count")
        return d[["subject","arm","week","diameter","change","visit_n"]].sort_values(["subject","week"]).reset_index(drop=True)
    if kind == "swimmer":
        out = s[["subject","arm","followup","milestone","ongoing"]].sort_values(["arm","followup","subject"], ascending=[True,False,True]).reset_index(drop=True)
        out["rank"] = np.arange(1,len(out)+1)
        return out
    if kind == "radar":
        q = q.loc[q.week==12].merge(s[["subject","arm"]], on="subject")
        out = q.groupby(["arm","domain"]).score.agg(estimate="mean",n="count").reset_index()
        out["missing"] = out.arm.map(s.arm.value_counts()) - out.n
        out["axis_order"] = out.domain.map({v:i+1 for i,v in enumerate(DOMAINS)})
        return out.sort_values(["arm","axis_order"]).reset_index(drop=True)
    if kind == "forest":
        f = q.loc[q.domain=="Fatigue"].pivot(index="subject", columns="week", values="score")
        f["change"] = f[12]-f[0]
        f = s.merge(f[["change"]],on="subject").dropna(subset=["change"])
        groups = [("Overall",f),("Female",f.loc[f.sex=="F"]),("Male",f.loc[f.sex=="M"]),
                  ("Age <65",f.loc[f.age<65]),("Age >=65",f.loc[f.age>=65])]
        out = []
        for i,(label,g) in enumerate(groups):
            a,b = [g.loc[g.arm==arm,"change"].to_numpy() for arm in ARMS[::-1]]
            est,lo,hi,df = welch(a,b)
            out.append(dict(subgroup=label,rank=i+1,n_reference=len(b),n_investigational=len(a),estimate=est,lower=lo,upper=hi,df=df))
        return pd.DataFrame(out)
    if kind == "shift":
        def category(v): return "L" if v<.5 else "N" if v<=1 else "H"
        out=[]
        for arm in ARMS:
            g=s.loc[s.arm==arm].dropna(subset=["alt_baseline","alt_week12"])
            for i,b in enumerate(["L","N","H"]):
                for j,p in enumerate(["L","N","H"]):
                    n=sum((g.alt_baseline.map(category)==b)&(g.alt_week12.map(category)==p))
                    out.append(dict(arm=arm,baseline=b,week12=p,n=int(n),denominator=len(g),percent=100*n/len(g) if len(g) else np.nan,row=i+1,column=j+1))
        return pd.DataFrame(out)

def theme():
    plt.rcParams.update({"font.family":"DejaVu Sans","font.size":10,"axes.spines.top":False,
        "axes.spines.right":False,"axes.edgecolor":"#C9C4BB","axes.labelcolor":"#423F3B",
        "text.color":"#292724","xtick.color":"#57534E","ytick.color":"#57534E",
        "figure.facecolor":"#FFFEFA","axes.facecolor":"#FFFEFA","savefig.facecolor":"#FFFEFA",
        "svg.fonttype":"path","svg.hashsalt":"clinical-figure-library-v1","axes.axisbelow":True})

def decorate(fig, kind, subtitle, note):
    fig.suptitle(TITLES[kind], x=.065, y=.965, ha="left", fontsize=19, weight="bold")
    fig.text(.065,.908,subtitle,fontsize=10,color="#69635B")
    fig.text(.065,.034,"SYNTHETIC TEACHING DATA  |  "+note,fontsize=8,color="#69635B")
    fig.text(.065,.012,"Jaime Yan | Clinical Figure Library v0.1.0 | Personal noncommercial use | Cite the repository",fontsize=7,color="#69635B")

def draw(kind, data):
    """Return an editable Figure. All calculations happen in prepare(), not here."""
    theme()
    if kind == "radar":
        fig=plt.figure(figsize=(10,7)); ax=fig.add_axes([.15,.14,.70,.69],projection="polar")
        angles=np.linspace(0,2*np.pi,len(DOMAINS),endpoint=False)
        ax.set_theta_offset(np.pi/2);ax.set_theta_direction(-1)
        for i,arm in enumerate(ARMS):
            g=data.loc[data.arm==arm].sort_values("axis_order")
            vals=g.estimate.to_numpy(); a=np.r_[angles,angles[0]];v=np.r_[vals,vals[0]]
            ax.plot(a,v,color=COLORS[arm],ls=["-","--"][i],marker=["o","s"][i],lw=2,label=arm)
            ax.fill(a,v,color=COLORS[arm],alpha=.065)
        ax.set_xticks(angles,DOMAINS);ax.tick_params(axis="x",pad=14)
        ax.set_ylim(0,100);ax.set_yticks([25,50,75,100]);ax.set_rlabel_position(18)
        ax.grid(color="#D8D4CC",lw=.7);ax.spines["polar"].set_color("#D8D4CC")
        ax.legend(loc="lower center",bbox_to_anchor=(.5,-.13),ncol=2,frameon=False)
        decorate(fig,kind,"Week 12 observed means | fixed 0-100 axes | higher is worse on every axis",
                 "Different spokes can have different n. Compare values, not polygon area.")
        return fig
    fig, ax=plt.subplots(figsize=(11,7))
    fig.subplots_adjust(left=.10,right=.95,bottom=.17,top=.80)
    if kind == "waterfall":
        for arm in ARMS:
            g=data.loc[data.arm==arm]
            ax.bar(g["rank"],g.estimate,color=COLORS[arm],width=.82,label=arm,
                   hatch="" if arm==ARMS[0] else "//",linewidth=.2,edgecolor="white")
        for y in [-30,20]:ax.axhline(y,color="#827C73",ls="--",lw=.9)
        ax.axhline(0,color="#827C73",lw=.8)
        ax.set_xticks(data["rank"],data.subject,rotation=90,fontsize=7)
        ax.set_ylabel("Best observed diameter change (%)");ax.set_xlabel("Participants ranked by best observed change")
        ax.grid(axis="y",alpha=.2);ax.legend(frameon=False,ncol=2,loc="lower left",bbox_to_anchor=(0,1.025))
        decorate(fig,kind,f"{len(data)} evaluable participants | ordered individual changes | lower is favorable",
                 "Dashed -30% / +20% guides are not confirmed RECIST response categories.")
    elif kind == "forest":
        fig.subplots_adjust(left=.30,right=.75)
        ax.axvline(0,color="#827C73",ls="--",lw=1)
        for i,r in data.iterrows():
            if i%2==0:ax.axhspan(i-.45,i+.45,color="#F2EFE9",zorder=0)
            ax.errorbar(r.estimate,i,xerr=[[r.estimate-r.lower],[r.upper-r.estimate]],fmt="D" if i==0 else "s",color=COLORS["Investigational"],capsize=4,ms=7)
            ax.text(1.025,i,f"{r.estimate:.2f} [{r.lower:.2f}, {r.upper:.2f}]",transform=ax.get_yaxis_transform(),va="center",fontsize=9)
        ax.set_yticks(range(len(data)),[f"{r.subgroup}   {r.n_reference}/{r.n_investigational}" for _,r in data.iterrows()])
        ax.invert_yaxis();ax.set_ylim(len(data)-.45,-.8)
        ax.set_xlabel("Mean difference (points)\nInvestigational minus Reference")
        ax.text(0,1.05,"Subgroup  |  n Ref/Inv",transform=ax.transAxes,ha="right",fontsize=9,weight="bold")
        ax.text(1.025,1.05,"Difference [95% CI]",transform=ax.transAxes,fontsize=9,weight="bold")
        ax.grid(axis="x",alpha=.18)
        decorate(fig,kind,"Week-12 Fatigue change | complete pairs | Welch t intervals | lower favors Investigational",
                 "Exploratory, overlapping subgroups. No interaction test or multiplicity adjustment.")
    elif kind == "swimmer":
        for i,arm in enumerate(ARMS):
            g=data.loc[data.arm==arm]
            ax.barh(g["rank"],g.followup,height=.64,color=COLORS[arm],alpha=.8,label=arm)
            ax.scatter(g.milestone,g["rank"],marker="D",s=16,facecolor="#FFFEFA",edgecolor="#292724",zorder=3)
            a=g.loc[g.ongoing==1];ax.scatter(a.followup,a["rank"],marker=">",s=40,color=COLORS[arm],zorder=4)
        ax.set_yticks(data["rank"],data.subject,fontsize=7);ax.invert_yaxis()
        ax.set_xlabel("Observed follow-up (weeks)");ax.set_xlim(0,data.followup.max()+2)
        ax.grid(axis="x",alpha=.2)
        ax.legend(handles=[Line2D([0],[0],lw=6,color=COLORS[a],label=a) for a in ARMS]+
                  [Line2D([0],[0],marker="D",color="#292724",ls="",markerfacecolor="white",label="Assessment"),
                   Line2D([0],[0],marker=">",color="#292724",ls="",label="Ongoing at cutoff")],
                  ncol=4,loc="lower left",bbox_to_anchor=(0,1.025),frameon=False,fontsize=8)
        decorate(fig,kind,f"{len(data)} participants | sorted within arm by duration | explicit event key",
                 "The assessment marker does not indicate response. Ongoing arrows do not extrapolate.")
    elif kind == "spider":
        for (_,arm),g in data.groupby(["subject","arm"]):
            ax.plot(g.week,g.change,color=COLORS[arm],ls="-" if arm==ARMS[0] else "--",lw=1,alpha=.58,marker="o",ms=2)
        ax.axhline(0,color="#827C73",lw=.8);ax.set_xticks([0,4,8,12])
        ax.set_xlabel("Scheduled visit (weeks)");ax.set_ylabel("Diameter change from baseline (%)")
        ax.grid(axis="y",alpha=.2)
        ax.legend(handles=[Line2D([0],[0],color=COLORS[a],ls="-" if i==0 else "--",label=a) for i,a in enumerate(ARMS)],frameon=False,ncol=2,loc="lower left",bbox_to_anchor=(0,1.025))
        decorate(fig,kind,"Individual observed trajectories | one line per participant | no fitted population trend",
                 "Missing visits break lines. Visit-specific observed n are available in the table.")
    elif kind == "shift":
        fig.delaxes(ax)
        for i,arm in enumerate(ARMS):
            ax=fig.add_axes([.12+i*.44,.22,.32,.52]);g=data.loc[data.arm==arm]
            matrix=g.pivot(index="row",columns="column",values="percent").to_numpy()
            ax.imshow(matrix,cmap="Blues",vmin=0,vmax=100)
            for _,r in g.iterrows():ax.text(r.column-1,r.row-1,f"{r.n}\n{r.percent:.1f}%",ha="center",va="center",color="#212121",fontsize=12)
            ax.set_xticks([0,1,2],["Low","Normal","High"]);ax.set_yticks([0,1,2],["Low","Normal","High"])
            ax.set_xlabel("Week-12 category");ax.set_ylabel("Baseline category")
            ax.set_title(f"{arm} | paired n={int(g.denominator.iloc[0])}",fontsize=11,pad=15)
        decorate(fig,kind,"ALT / ULN | Low <0.5; Normal 0.5-1; High >1 | count and % of paired arm n",
                 "Missing pairs excluded. Color scale fixed at 0-100%. Thresholds are illustrative.")
    else:raise ValueError("Unknown figure kind")
    return fig